
Bosch, Zhang, Abler, Shortle, Hu, Huang, Sharma, Rasool, and Zhang are looking at how the economic and environmental sustainability of agriculture in the Chesapeake Bay watershed is impacted by national-level government policies and market developments. To accomplish this task they are using the Regional Environment and Agriculture Programming (REAP) model. REAP is a large-scale, partial-equilibrium economic-environmental model of the U.S. agricultural sector developed by USDA’s Economic Research Service (ERS). The model is partial equilibrium in the sense that it focuses on the agricultural sector and not other sectors of the economy.
The REAP model currently divides the U.S. into 273 agricultural production regions, with 10 major commodity crops and 4 major livestock product groups. Many of the 273 production regions are further subdivided into highly erodible and normal cropland, resulting in 456 combinations of region and soil erodibility class. 33 of the 273 regions lie partly or entirely in the Chesapeake Bay watershed. Crop and livestock outputs in the REAP model are processed into food, livestock feed, and bioenergy products.
The REAP model is used to simulate the regional allocation of agricultural resources (land, fertilizer, water, and other inputs) and agricultural production in response to changes in policy, market, and biophysical conditions. The research team is currently working with ERS and other cooperating institutions to update and refine the REAP model.
Team members at Virginia Tech, Darrell Bosch, Natu Hu, and Wei Zhang, used the REAP model to evaluate effects of energy cost changes on U.S. and regional crop and livestock production, consumption, and prices. Higher energy prices lead to higher crop prices in most cases. Crop output declines except for corn and soybeans, which benefit from higher ethanol and biodiesel prices. Corn supply increases by 2.9 percent with the highest energy shock of 30 percent with most of the increased supply going into ethanol production. Crop output increases the most in farm regions having large shares of corn (Corn Belt and Northern Plains). Livestock production tends to decline in response to higher energy costs. Total livestock value tends to increase as price increases offset the effects of reduced output. The regional distribution of the value of livestock output changes very little (less than one percent) in response to energy price increases.
They are currently extending the energy price modeling by introducing an ethanol import and export market. Ethanol price and quantity changes resulting from energy price increases have a large impact on the agricultural sector particularly areas with a large proportion of corn production.
In addition to the work using the REAP model, Penn State research team members Sadikshya Sharma and Dave Abler are examining trends in agricultural production and environmental indicators in urbanized landscapes – metro counties and metro-adjacent counties – over the period from 2007 to 2017. The team is examining both counties in the Chesapeake Bay watershed and in the U.S. as a whole. Using data envelopment analysis (DEA) and cluster analysis, the questions the team is investigating are: where is agriculture thriving both economically and environmentally, which counties are doing better than others on the agricultural and environmental indicators, how do counties sort themselves into clusters, and what can be learned from the counties that are doing better than others. Click here to view the agricultural and environmental trends in urbanized counties.
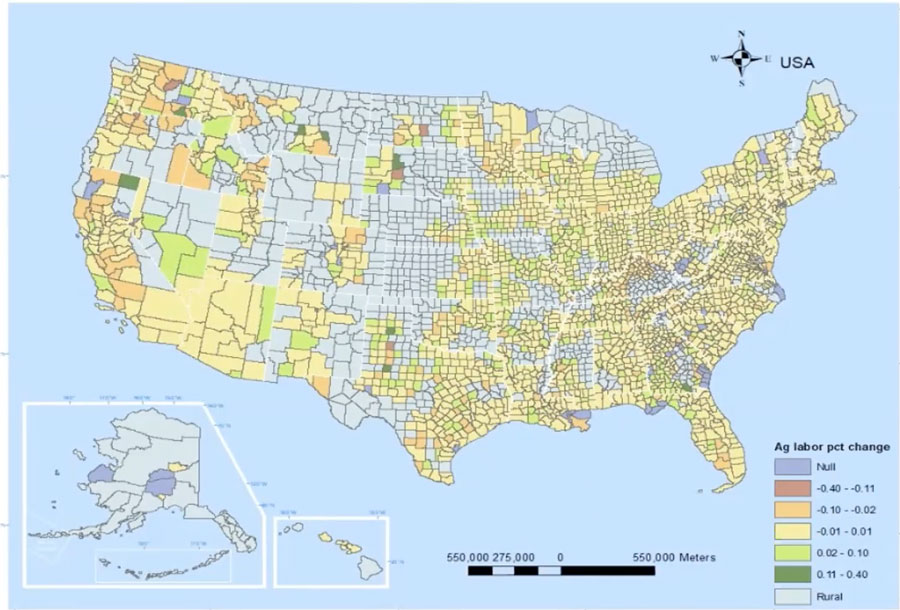
Two other Penn State team members, Dave Abler and Asif Rasool are doing a clustering analysis to identify the urbanized agricultural regions in the US using the USDA ERS census database. The team is using a combination of traditional clustering methods (ex: hierarchical, k-means) and a more advanced machine learning algorithm (DBScan), utilizing county-level data from the last four censuses. The primary objective of the clustering analysis is to cluster the US agricultural region based on production potential (ex: labor productivity, degree of mechanization, farm size, farm income, and so on). The second part of the study will contain a rigorous financial analysis based on the clusters identified in the first part. The second part will provide valuable insights on the prospect of investment, consumption, and government programs.
Rasool, A.; Abler, D. Heterogeneity in US Farms: A New Clustering by Production Potentials. Agriculture 2023, 13, 258. https://doi.org/10.3390/agriculture13020258.
Zhang, Z., and D. Abler (2023). “Dairy Pricing Policy, Production, and Water Quality: Application to the Chesapeake Bay Watershed.” Journal of the Agricultural & Applied Economics Association, 2(2):350-365.
Hu, C., Z. Chen, P. Liu, W. Zhang, X. He, & D. Bosch. Impact of large-scale solar on property values in the United States: Diverse effects and causal mechanisms, Proc. Natl. Acad. Sci. U.S.A. 122 (24) e2418414122, https://doi.org/10.1073/pnas.2418414122 (2025).

Professor, Department of Agricultural and Applied Economics, Virginia Tech
bosch@vt.edu
Link to bio

Distinguished Professor Emeritus of Agricultural and Environmental Economics, Penn State
jshortle@psu.edu
Link to bio

Professor of Agricultural Economics, Penn State, and Project Director
dga2@psu.edu
Link to bio

PhD Student, Department of Agricultural and Applied Economics, Virginia Tech
huchenyang@vt.edu

Research Economist at Employment Security Department (ESD) of Washington State
xtw.huang@gmail.com
Linkedin

PhD Student, Energy, Environmental, and Food Economics, Penn State
azr496@psu.edu
Link to bio

MS Student, Department of Ecosystem Science and Management, Penn State
sbs6203@psu.edu
Link to bio

Assistant Professor, Department of Agricultural and Applied Economics, Virginia Tech
wei_zhang@vt.edu
Link to bio

Postdoc, Department of Agricultural Economics, Penn State
zmz5064@psu.edu


Project funded by USDA's National Institute of Food and Agriculture
Copyright Thriving Agricultural Systems in Urbanized Landscapes – 2026